View Church Center analytics
You put the time into creating a great Church Center experience for your congregants, and now you're wondering—which Church Center pages are your congregation actually engaging with? Good news! On the Dashboard page in Publishing, you'll find data showing how your congregation connects with the content you publish on Church Center.
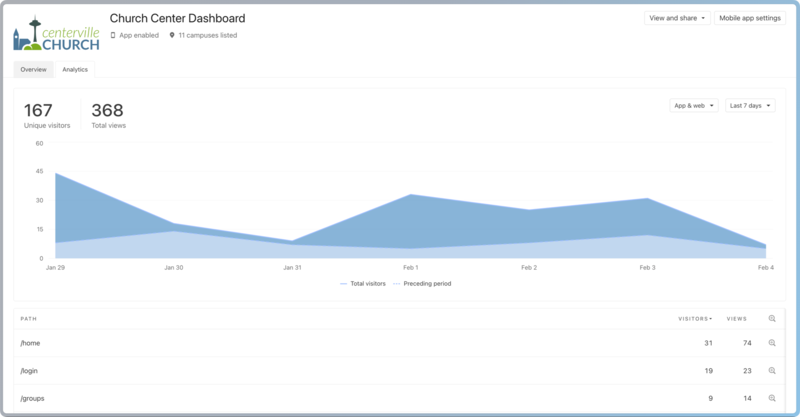
Select the Dashboard page in the top navigation and then select the Analytics tab to see the data showing the total number of visitors and page views over a selected timeframe. This includes built-in pages (like groups and home) and custom Publishing content (like custom pages and sermons).
Filter analytics data
Use the dropdowns in the top right corner of the graph to filter your data. These filters affect both the graph and the path list below it.
Platform: The first dropdown is set to App & web by default, showing visitor data from both the Church Center app and web platforms. You can also select either App or Web options to view data from just that platform.
Timeframe: The second dropdown is set to Last 7 Days by default. Use this dropdown to select the timeframe of data you want to view.
View data for a specific page
Below the graph is a list of pages and the individual visitor and view counts for that page. Select the name of a page to open it in a new web browser tab.
Visitors: The total number of unique logged-in users and guests.
Views: The total number of times a web page has been loaded or reloaded. If one person visits a page five times, it counts as five views.
Select the Path, Visitors, or Views column headers to sort the list by that column.
Select the 🔍 magnifying glass icon at the end of a path's row to update the graph to show the data for that page only. Select the icon again to reset the graph to show overall data.
Tip
Looking for even more analytics data? Check how many people have watched your live or on-demand videos, and add the active Church Center app users Publishing widget to your dashboards!