Event chart reporting
Generate unique attendance numbers to track the health of your services. You can view them as a graph or download them as a CSV file.
These graphs show the number of unique people checked in or counted in Headcounts.
Event chart overview
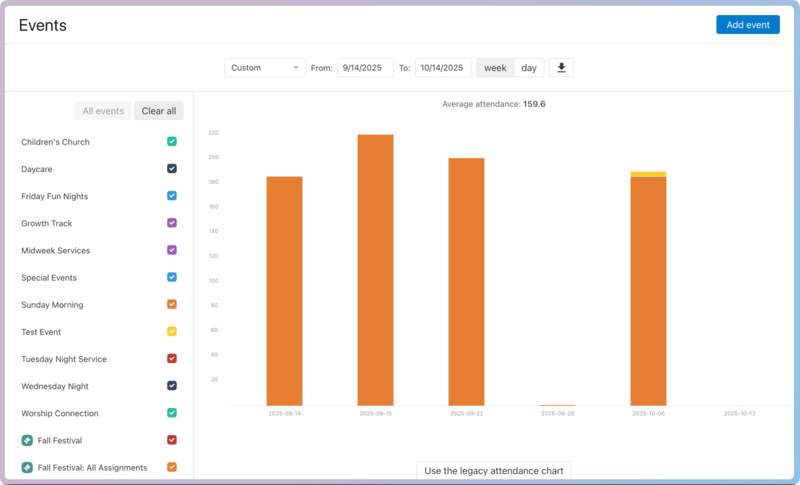
Choose a time frame using the date picker at the top.
Choose specific events to show on the graph using the checkboxes in the left sidebar.
Choose a daily or weekly view.
Export the data shown in the graph as a CSV file using the ⬇️ download icon at the top.
Hover over a bar in the graph to see specific attendance numbers for that event and time frame.
Once you've chosen a time frame and selected specific events, the graph changes accordingly.
Tip
You can display archived events by scrolling to the bottom of the left sidebar and selecting the Include archived events option.
Selecting a single event
If you select a single event, you'll be able to see more detailed information in the graph about that event.
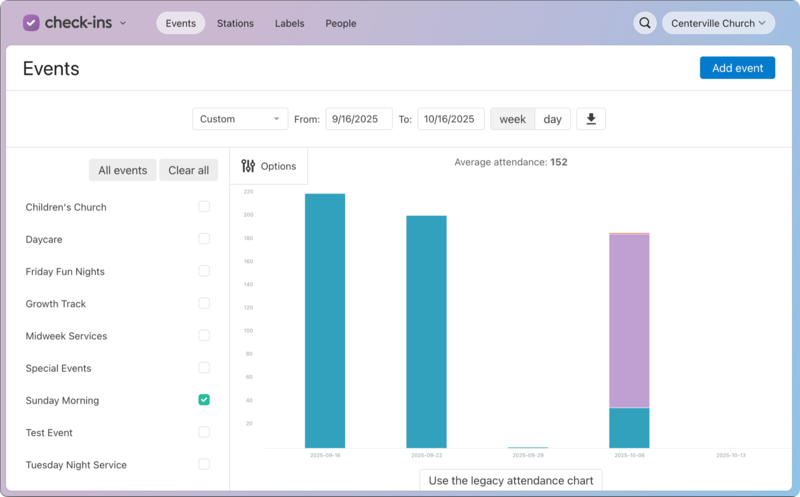
Use the Options menu to get more specific information.
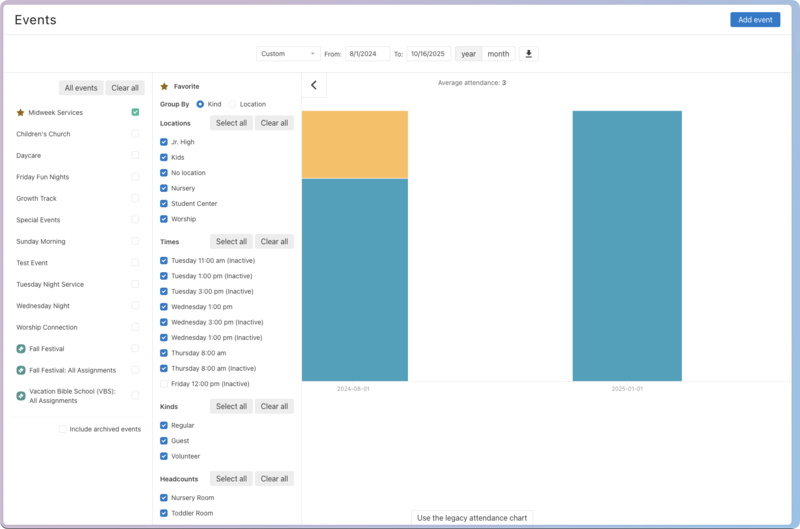
Mark an event as a favorite. Favorited events will filter to the top of your Events list.
Group check-ins on the graph by kind (Regular, Guest, Volunteer) or location.
Select specific locations to include in the graph.
Select Times to include in the graph.
Tip
"Inactive" times are any times in past session dates that are not on your current session date. You can select one of these to include data from those past times.
Filter the Kinds you want to show in the graph.
Filter any Custom Headcounts categories you would like to see in the graph.